
Lesson 7 · Investing · 10 min read
Compound Interest Explained: Why $25 a Week Becomes $284,000
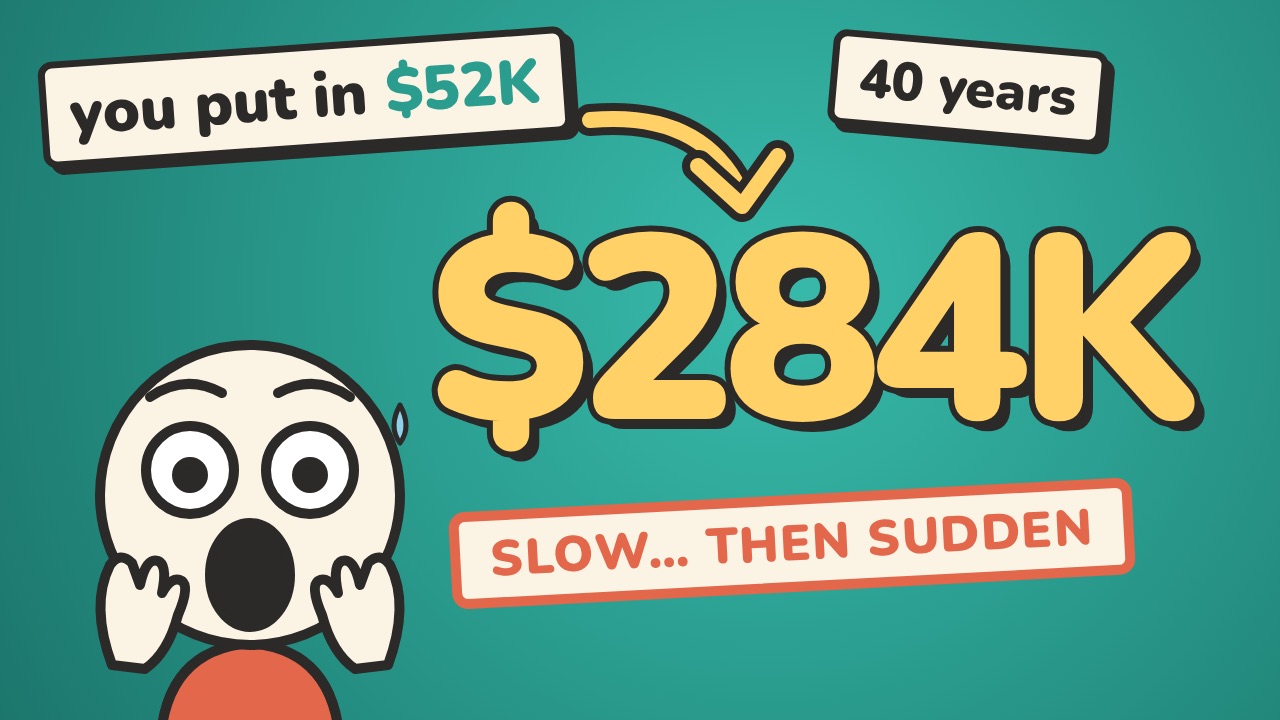
$25 a week, invested for 40 years, could grow to about $284,000 even though you only put in $52,000. Here's the curve behind it, and why the first ten years feel like nothing is happening.
Updated
The lesson in 30 seconds
- Compound interest means your interest earns interest. $10,000 at 7% for 30 years becomes $31,000 with simple interest but about $76,000 compounded.
- $25 a week ($52,000 in total) at a 7% average return for 40 years grows to about $284,000.
- The curve goes slow, slow, then sudden: the last 10 years add about $152,000, more than the first 30 years combined.
- Time beats amount: invest for 10 years and stop, and you can still end up ahead of someone who invests 3× as much but starts 10 years later.
- Compounding also works against you: a 22% card can double in about 3 years, and a 1% fee can cost about $68,000 over 40 years.
Twenty-five dollars a week. That's about $3.50 a day. Invest it for forty years and you could end up with around $284,000.
Here's the strange part: over those forty years you only put in $52,000. So where did the other $232,000 come from? And why, for the first ten years, does it feel like absolutely nothing is happening?
The answer is compound interest. In this lesson we draw the curve that explains it: slow, slow, then sudden. Once you see this curve, you'll never look at time the same way again.
Simple interest vs compound interest
There are two kinds of interest, and the difference between them is the whole story.
Imagine you put $10,000 somewhere that earns 7% a year and leave it alone for thirty years.
- With simple interest, you earn 7% of your original $10,000 every year: $700 a year, every year. After 30 years you have $31,000.
- With compound interest, you earn 7% on everything you have, including the interest you've already earned. After 30 years you have about $76,000.
Same money, same rate, same thirty years, and one ends up with more than twice as much. The only difference is that compound interest lets your interest earn interest.
The snowball: interest on interest
Let's slow that down, because this is the whole secret. Say you have $1,000 earning 7% a year:
| Year | Balance at start | Interest earned that year | Balance at end |
|---|---|---|---|
| 1 | $1,000.00 | $70.00 | $1,070.00 |
| 2 | $1,070.00 | $74.90 | $1,144.90 |
| 3 | $1,144.90 | $80.14 | $1,225.04 |
| 4 | $1,225.04 | $85.75 | $1,310.80 |
| 5 | $1,310.80 | $91.76 | $1,402.55 |
Each year the pile is bigger, so each year the interest is bigger, so the next year the pile is even bigger, even though you did nothing.
It's like a snowball rolling down a hill. At the top it's tiny and barely picks up any snow. But the bigger it gets, the more snow it grabs with every turn. At the bottom of the hill it isn't growing by handfuls anymore. It's growing by armfuls.
The compound interest formula
If you want to calculate it yourself, here's the standard formula for a single deposit:
A = P × (1 + r/n)^(n × t)
- A is the final amount
- P is the starting amount (the principal)
- r is the yearly interest rate as a decimal (7% = 0.07)
- n is how many times a year interest is compounded (1 = yearly, 12 = monthly)
- t is the number of years
For $10,000 at 7% compounded yearly for 30 years: 10,000 × 1.07^30 ≈ $76,123.
How often interest compounds matters a little, though much less than the rate or the time:
| $10,000 at 7% for 30 years | Final amount |
|---|---|
| Compounded yearly | about $76,123 |
| Compounded quarterly | about $80,192 |
| Compounded monthly | about $81,165 |
| Compounded daily | about $81,645 |
When you add money regularly (like $25 a week), the math is easier with a calculator or spreadsheet. Every figure in this lesson uses monthly compounding.
The penny puzzle
Here's a famous puzzle that shows the shape of compound growth. Would you rather have $1 million today, or a single penny that doubles every day for 30 days?
Most people take the million. Let's follow the penny:
| Day | Penny's value |
|---|---|
| 10 | $5.12 |
| 20 | $5,242.88 |
| 25 | $167,772.16 |
| 28 | $1,342,177.28 |
| 30 | $5,368,709.12 |
Two-thirds of the month is gone and you have about $5,000; the million looks like the smart choice. Then on day 30 the penny is worth more than $5.3 million, and half of all that money appears on the very last day.
Nothing in real life doubles every day; this is just a puzzle. But the shape is real: slow, slow, slow, then sudden. That's the shape of compound interest, and the most dangerous moment is the slow part, because that's when people give up.
The real curve: $25 a week for 40 years
Back to our $25 a week ($108.33 a month), with a 7% average yearly return. Over long periods the US stock market has averaged roughly 10% a year before inflation, with big ups and downs along the way. We use 7% to stay on the careful side. Real returns vary, and some years are negative.
| After | You put in | Balance | Of which growth |
|---|---|---|---|
| 1 year | $1,300 | about $1,343 | about $43 |
| 10 years | $13,000 | about $18,751 | about $5,751 |
| 20 years | $26,000 | about $56,434 | about $30,434 |
| 30 years | $39,000 | about $132,164 | about $93,164 |
| 40 years | $52,000 | about $284,355 | about $232,355 |
Look at the shape. For the first decade the line barely leaves the ground. Then it starts to bend. Then it shoots up.
Three moments inside the curve
There are three moments inside that curve worth knowing.
Moment 1, around year 11: your money out-earns you. That's when your balance earns more in a single year than you put in during that year. You add about $1,300 a year; now your money adds about $1,400 on its own.
Moment 2, around year 19: growth passes deposits. Total growth passes the total you've ever put in. From here on, most of your pile is money you never had to earn.
Moment 3, the last decade: bigger than everything before it. From year 30 to year 40 the balance grows by about $152,000. That's more than the entire $132,000 built in the first thirty years combined.
Same $25 a week. The money didn't change. Time did.
Why compound interest feels so slow at the start
Our brains think in straight lines. If you save $100 a month, you expect your pile to grow by about the same amount each month, and at the beginning that's exactly what happens. Your contributions are almost the whole story; the growth is just a few dollars.
That's the trap. People check their account after two years, see it grew by a couple of hundred dollars, and decide investing doesn't work for people like them. So they stop.
They're judging a curve by its flattest part. It's like planting a tree, checking it after a week and deciding trees don't grow.
The early years have another problem: when the market drops, it feels loud. You see red numbers, and the growth you were waiting for disappears for a while. Stopping or selling in the boring part is the most expensive mistake in compound interest, because it doesn't just cost you that year. It cuts off the steep part of the curve you were heading toward.
The Rule of 72: how fast does your money double?
Here's a shortcut to feel compound interest in your head. Divide 72 by your yearly interest rate; the answer is roughly how many years it takes your money to double.
| Where the money is | Rate | Doubles in about |
|---|---|---|
| Average US savings account | 0.37% | about 195 years |
| High-yield savings account | about 4% | about 18 years |
| Stock market (our assumption) | 7% | about 10 years |
| Credit card debt (working against you) | 22% | about 3.3 years |
At the average savings rate, your money would double around the year 2220. One simple division, and you can see why where you keep your money matters so much. (Lesson 3 explains why bank rates are so low.)
Where compound interest happens
Compound interest isn't magic. It needs a place to live.
Savings accounts. The bank pays you interest, and next month that interest earns interest too. It's safe and it's where your emergency fund belongs, but at low rates the snowball rolls slowly.
Investing. When you own a piece of many companies, for example through an index fund, your money can grow as those companies grow. Many companies also pay out part of their profits as dividends. Reinvest those dividends instead of spending them and they buy more shares, which pay more dividends. That's compounding too.
Tax-advantaged accounts. In the US, a 401(k) at work or an IRA you open yourself lets that growth happen with tax advantages. Fewer taxes taken out along the way means a bigger snowball. Lesson 13 compares the 401(k) and the Roth IRA.
The rule is the same everywhere: the money, and whatever it earns, has to stay in. Every time you take the growth out, you reset part of the snowball.
Alex vs Sam: time beats amount
Let's see what time really does, with an illustrative example.
- Alex starts at 25, investing $25 a week. At 35, Alex stops adding money and just leaves it there. Ten years of saving. Total put in: $13,000.
- Sam starts at 35 with the same $25 a week, and keeps going for thirty years, all the way to 65. Total put in: $39,000, three times as much as Alex.
Both earn the same 7%. At 65:
| Years contributing | Total put in | Balance at 65 | |
|---|---|---|---|
| Alex (25 to 35, then stops) | 10 | $13,000 | about $152,000 |
| Sam (35 to 65) | 30 | $39,000 | about $132,000 |
Alex put in one-third of the money and still ends up ahead, because Alex's money had ten extra years to compound. When it comes to compound interest, time is more powerful than amount.
But there's a second lesson here, just as important: Sam still turned $39,000 into about $132,000. Starting later is not too late. The curve starts whenever you start. The worst choice isn't starting at 35. It's waiting until 45.
The dark side: compound interest on debt
Compound interest works just as hard against you. Remember the credit card from Lesson 2? At 22%, the Rule of 72 says an unpaid balance can double in a little over three years.
That's the same snowball, rolling in the wrong direction. Every month you don't pay it off, the interest is added to the balance, and next month you pay interest on the interest.
So think of it this way: paying off a card that charges 22% is like earning a guaranteed 22% return. No investment can promise you that. That's why most plans deal with high-interest debt before investing beyond any employer match. Lesson 8 lays out the full order.
The quiet leak: fees
One more thing quietly eats compound interest: fees. A 1% fee sounds tiny, one dollar out of every hundred. But fees compound too.
| $25 a week for 40 years | Net return | Final balance |
|---|---|---|
| No fee | 7% | about $284,000 |
| 1% yearly fee | 6% | about $216,000 |
| Cost of the fee | about $68,600 |
That 1% fee costs about $68,600, almost a quarter of everything. This is why so many investors love low-cost index funds, which often charge well under 0.1% a year. A small fee, over a long time, is never small.
What you can actually control
You don't control the return; nobody controls the market. But you control four things:
- Time. When you start. Every year you start earlier gives your money one more year at the steep end of the curve.
- Amount. How much you add, and it doesn't have to stay the same. Remember Alex's raise rule from Lesson 6: half of every raise goes to the future, automatically.
- Cost. Keep fees low, and keep high-interest debt away.
- Behavior. This is the big one. Don't interrupt the curve. Keep adding through the boring years, and don't sell in a panic when the market drops.
The people who win with compound interest usually aren't the smartest. They're the ones who stayed.
Three things to do this week
- Find your doubling time. Look up the interest rate on your savings account and divide 72 by it. If the answer is longer than your lifetime, your money deserves a better home.
- Start the snowball. Set up one automatic transfer to savings or investing, even $25 a week. The amount matters less than the start date.
- Check your fees. If you invest through a workplace plan or on your own, find the expense ratio of each fund. If you see 1% or more, write it down.
Frequently asked questions
What is compound interest in simple terms?
Compound interest is interest earned on both your original money and the interest it has already earned. Because the interest is added to the balance, each period's interest is a little bigger than the last, which makes growth speed up over time.
What is the formula for compound interest?
For a single deposit, A = P × (1 + r/n)^(n × t), where P is the starting amount, r is the annual rate as a decimal, n is the number of compounding periods per year and t is the number of years. For example, $10,000 at 7% compounded yearly for 30 years grows to about $76,123.
How much will $25 a week be worth in 40 years?
At a 7% average annual return compounded monthly, investing $25 a week for 40 years grows to about $284,000. You contribute $52,000, so about $232,000 is growth. Real returns vary and can be negative in some years.
What is the Rule of 72?
The Rule of 72 estimates how long money takes to double: divide 72 by the annual rate. At 7%, about 10 years; at 4%, about 18 years; at 0.37%, about 195 years. It also shows how fast debt grows: at 22%, a balance can double in about 3.3 years.
Does compounding frequency matter?
A little. $10,000 at 7% for 30 years grows to about $76,123 compounded yearly and about $81,165 compounded monthly. The interest rate and the number of years matter far more than how often interest is compounded.
Is it too late to benefit from compound interest if I start at 35 or 45?
No. Starting later means less time for growth, so you may need to invest more each month, but compounding still works for every year your money stays invested. In our example, starting at 35 with $25 a week still grows to about $132,000 by 65.
Assumptions and sources
$25 a week = $108.33 a month (25 × 52 ÷ 12), invested at the end of each month at a constant 7% average annual return, compounded monthly; figures calculated by Money, Drawn Out. The 7% is a conservative illustration: long-run US stock market returns have averaged roughly 10% a year before inflation (for example NYU Stern / Damodaran historical data since 1928), with large ups and downs and negative years. Savings rates: FDIC national average 0.37% (via FRED, September 2026); high-yield around 4% (Bankrate, September 2026). Credit card APR about 22% (Federal Reserve G.19). The Rule of 72 is an approximation. Sam and Alex are illustrative examples. Real returns vary and can be negative.
One new lesson every week
Each lesson builds on the one before. Subscribe on YouTube so you don't miss the next one.
Subscribe on YouTube See all lessonsKeep learning
Lesson 1 · Investing
What Happens If You Invest $100 a Month? The Honest Math
You put in $48,000. You could walk away with about $262,000. Here is exactly where the other $214,000 comes from, and why waiting ten years costs more than $140,000.
Lesson 9 · Investing
What Happens If You Invest $10,000 in an Index Fund? The Honest Math
Videos promise that $10,000 in an index fund becomes $700,000. That needs almost 15% a year for 30 years. Here's the honest version, how index funds beat most stock pickers, and the number you can actually plan on.
Lesson 13 · Investing
401(k) vs Roth IRA: Why It's a Perfect Tie (Until It Isn't)
Sam's 401(k) statement says $887,000 and Alex's Roth says $781,000. After tax, they keep exactly the same amount. Here's why, the four things that break the tie, and which account to fill first.