
Lesson 9 · Investing · 11 min read
What Happens If You Invest $10,000 in an Index Fund? The Honest Math
Videos promise that $10,000 in an index fund becomes $700,000. That needs almost 15% a year for 30 years. Here's the honest version, how index funds beat most stock pickers, and the number you can actually plan on.
Updated
The lesson in 30 seconds
- An index fund is a basket holding a slice of every company on a list, such as the S&P 500, at a very low cost.
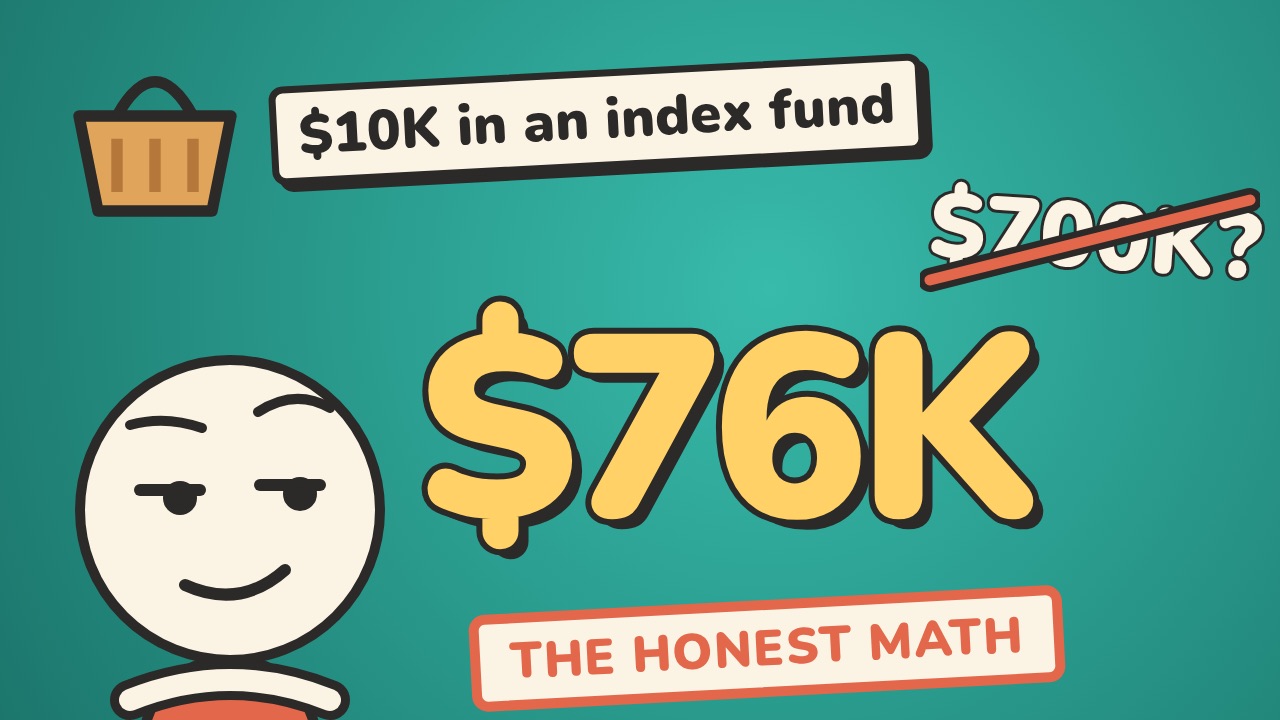
- $10,000 at 7% (roughly the long-run average after inflation) grows to about $19,700 in 10 years, $38,700 in 20 and $76,100 in 30. The "$700,000" claim assumes almost 15% a year.
- Most individual stocks (about 58%) lagged Treasury bills over their lifetimes, and about 93% of active large-cap funds trailed the S&P 500 over 20 years.
- A 1% fee instead of 0.03% costs about $18,000 on $10,000 over 30 years.
- $10,000 plus $100 a month for 30 years at 7% is about $203,000, which could support roughly $8,100 a year under the 4% rule.
You've probably seen videos promising that $10,000 in an index fund turns into $700,000. Maybe it can. But only if one assumption holds: that the market grows almost 15% a year, every year, for thirty years. That's roughly double the long-term average after inflation.
So let's do the honest version. What actually happens if you invest $10,000 in an index fund? How does that compare with picking a few stocks yourself? And what's the number you can actually plan your life around?
Same $10,000, honest numbers. This is step 5 of the smartest order to use your money: looking inside the investing glass.
What is an index fund?
Picture a basket. Inside are tiny slices of hundreds of companies: some make phones, some make medicine, some sell groceries, some run banks.
An index is just a list with a rule. The S&P 500, for example, is a list of about 500 of the largest US companies. An index fund simply buys everything on that list, in the same proportions. There's no manager trying to guess which company will win next year; the basket holds the whole list.
When you buy one share of an index fund, you own a tiny slice of the whole basket. If the companies, on average, grow and earn more over time, the basket grows with them.
Why index funds are so cheap: the expense ratio
Because nobody is picking and choosing, index funds can be very cheap to run. Every fund charges a yearly fee called the expense ratio, taken out of the fund automatically.
| Type of fund (examples) | Expense ratio | Yearly cost on $10,000 |
|---|---|---|
| Some broad index funds and ETFs | 0.03% | $3 |
| Many actively managed funds | up to about 1% | up to about $100 |
One percent sounds tiny. Hold on to that thought; we'll see exactly what it costs.
You can buy index funds as a mutual fund or as an ETF (exchange-traded fund). For a beginner the difference is mostly how you buy them, not what's inside. And you can hold them inside an IRA or a workplace 401(k).
How to actually buy an index fund
It's simpler than most people think:
- Open an account. That can be your workplace retirement plan, an IRA or a regular brokerage account.
- Find a broad index fund inside that account. Usually that means one tracking the whole US market, the S&P 500 or the whole world. The words "index" or "total market" are often right in the name.
- Check the expense ratio, then buy. Many brokerages let you start with small amounts, and some let you buy fractions of a share. You don't need $10,000 to begin.
That's it. No stock tips, no watching the screen every day. (We don't recommend any specific fund; compare the options your account offers.)
Index fund vs picking 5 stocks
Meet our two investors. Sam and Alex each have $10,000 to invest for the long term.
- Sam puts all $10,000 into one broad index fund: hundreds of companies, one basket, a very low fee.
- Alex wants something more exciting and picks five stocks, companies Alex knows and likes, $2,000 in each.
Alex's thinking makes sense on the surface: why own hundreds of average companies when you could just own the five best ones? The problem is the word best. You only know which ones were best afterwards.
The surprising 4%: most stocks don't beat T-bills
Here's a fact about the stock market that surprises almost everyone. Finance professor Hendrik Bessembinder studied nearly 26,000 US stocks from 1926 to 2016. Over their lifetimes, about 58% of them didn't even beat a plain, safe one-month Treasury bill.
So where did the stock market's extra gains come from? From a tiny group: about 4% of companies created all of the market's net wealth above Treasury bills.
Think about what that means for Alex. To do well, Alex needs at least one of those five eggs to be one of the rare superstars. Miss them, and Alex can do worse than a savings bond, even in a great decade for the market.
Sam's basket doesn't need to guess. It owns all of them, the superstars included. Whoever the winners turn out to be, Sam already holds a slice.
Three possible futures for a stock picker
Let's draw three possible futures for Alex:
| Future | What happens to Alex's 5 stocks | Alex vs Sam |
|---|---|---|
| 1. The superstar | One company becomes a giant and carries the whole portfolio | Alex beats Sam, maybe by a lot |
| 2. The middle | All five do okay, some up, some down | Roughly the same as Sam, with much more stress |
| 3. The miss | Two struggle and one eventually goes to zero | Alex falls well behind Sam |
Alex doesn't get to choose which future happens. The point isn't that Alex always loses; it's that Alex's range of outcomes is enormous. Sam's is much narrower, because Sam's basket holds every future at once.
93% of the pros trail the index
"Okay," says Alex, "but I'll do my research." Professional fund managers research full time, with teams, data and years of experience. Every year, S&P Dow Jones Indices compares them with the simple index in its SPIVA report.
In the latest one (year-end 2025), over 20 years, about 93% of actively managed large-company funds did worse than the S&P 500. Over 10 years it was about 86%.
That doesn't mean picking stocks always loses; some people win. But the odds aren't on your side, and you won't know in advance whether you're the lucky one. Owning the whole basket is a way of not needing to be lucky.
What $10,000 really becomes at 7%
So what does Sam's $10,000 turn into? To plan honestly, we use 7% a year. Over the long run, the US stock market has averaged roughly 10% a year before inflation and about 7% after inflation. Using 7% gives an answer in roughly today's dollars, the kind of money you can picture buying groceries with.
| Years | $10,000 at 7% a year | $10,000 at 10% a year (future dollars) |
|---|---|---|
| 10 | about $19,700 | about $25,900 |
| 20 | about $38,700 | about $67,300 |
| 30 | about $76,100 | about $174,500 |
At 7%, that's more than seven times the money without adding a single extra dollar. As we saw in Lesson 7, compounding goes slow, then sudden: more than half of the growth happens in the last ten years.
Where the $700,000 numbers come from
Back to that $700,000. Put three lines on the same chart, each starting with $10,000:
| Assumed yearly return | After 30 years | What it represents |
|---|---|---|
| 7% | about $76,000 | Long-run average after inflation |
| 10% | about $174,000 | Long-run average before inflation (in future dollars) |
| about 14.7% | about $607,000 (plus dividends, near $700,000) | The best recent stretch, assumed to last 30 more years |
The third line is what you get if you take the best decade in recent memory, driven mostly by big tech, and assume it continues for thirty more years. Could it happen? Maybe. Should you plan your retirement on it? No.
Same money. The only thing that changed is the assumption. Whenever you see a huge number in a title, look for the percent behind it.
The real line is bumpy (2008: −37%)
That smooth 7% line doesn't exist in real life. The real line is bumpy: some years the market is up 20%, some years it's down. In 2008, the S&P 500 fell about 37% in a single year. Sam's $10,000 would have looked like about $6,300 on the screen.
The investors who got hurt most were those who sold near the bottom, turning a temporary drop into a permanent loss. Those who held on and kept buying recovered within a few years and went on to new highs.
That's why this glass comes only after the emergency fund is full. When the market drops, you never want to sell your basket to pay for a car repair.
A 1% fee costs about $18,000
Remember that fee? Give Sam two versions of the same investment: same $10,000, same 30 years, same market (7% before fees).
| Expense ratio | Net yearly return | After 30 years |
|---|---|---|
| 0.03% | 6.97% | about $75,500 |
| 1.00% | 6.00% | about $57,400 |
| Difference | about $18,000 |
That's a difference of about $18,000 on a starting amount of $10,000, just from a fee most people never notice, because it's taken out quietly every year. Before you buy any fund, find one number: the expense ratio. Lower is better.
Dividends and reinvesting
Part of that 7% comes from dividends. Many companies share a slice of their profits with their owners, usually every three months. When you own an index fund, those payments flow into your account.
You can take them as cash, or reinvest them, automatically buying more of the basket. Those new shares earn their own dividends, which buy more shares: the snowball from Lesson 7 again. For a long-term investor, reinvesting is usually the default; in most accounts it's a single setting such as "reinvest dividends".
$10,000 + $100 a month: about $203,000
Here's the version that matters most for a beginner. Most people don't start with $10,000, and even if you do, the real power comes from what you add afterwards.
Say Sam invests the $10,000 and then adds just $100 a month, about $25 a week. After 30 years at 7%, Sam has put in $46,000 in total, and the account is worth about $203,000, in roughly today's money.
That's the honest version of a big number. It doesn't need 15% a year. It needs a cheap basket, a small habit and time.
Why starting 10 years earlier doubles it
Now give the same plan ten more years. $10,000 plus $100 a month at 7%:
| Time invested | Total put in | Balance |
|---|---|---|
| 30 years | $46,000 | about $203,000 |
| 40 years | $58,000 | about $426,000 |
Ten extra years, $12,000 more in deposits, and the balance more than doubles. That's the same lesson Alex and Sam taught us in Lesson 1: time beats amount.
How much could it actually pay you? The 4% rule
A big balance is nice, but what you really want to know is: how much income could it provide? A popular rule of thumb from retirement research (William Bengen, 1994) is the 4% rule: withdraw about 4% of your portfolio in the first year of retirement, then adjust that amount for inflation each year.
| Portfolio | About 4% in year one | Per month |
|---|---|---|
| $76,000 ($10,000 alone, 30 years) | about $3,000 | about $250 |
| $203,000 ($10,000 + $100/month, 30 years) | about $8,100 | about $680 |
| $426,000 ($10,000 + $100/month, 40 years) | about $17,000 | about $1,420 |
The 4% rule is a planning guideline, not a guarantee: markets, inflation and how long retirement lasts can change the answer. But it turns an abstract number into something you can picture.
3 index fund mistakes
1. Selling when the market drops. The drop feels like proof something is wrong. For a long-term investor it's usually just the bumpy line doing what it always does.
2. Chasing last year's winner. Jumping into whatever went up most last year, then jumping out when it cools. The basket works because you hold it, not because you time it.
3. Paying high fees for "the best funds". A fancy name doesn't mean better results. Most expensive active funds fall behind the plain, cheap index over the long run.
Three things to do this week
- Look at what you already own. If you have a workplace plan or an IRA, open it and find the funds you're in.
- Find each fund's expense ratio. If it's close to 1%, check whether your plan offers a broad index fund with a much lower fee.
- Pick your planning number honestly. Use 7%, not 15%. If the market does better, that's a bonus, not a plan.
Frequently asked questions
How much will $10,000 be worth in an index fund in 30 years?
At a 7% average annual return, roughly the long-term US stock market average after inflation, $10,000 grows to about $76,000 in 30 years in today's dollars. At 10% (the average before inflation) it would be about $174,000 in future dollars. Real returns vary year to year and are not guaranteed.
Is it better to invest in index funds or individual stocks?
For most beginners, broad index funds are the simpler, lower-risk choice. Research by Hendrik Bessembinder found that about 58% of US stocks underperformed Treasury bills over their lifetimes, and the SPIVA report found about 93% of active large-cap funds trailed the S&P 500 over 20 years. An index fund owns the rare big winners automatically.
What is a good expense ratio for an index fund?
Many broad index funds and ETFs charge well under 0.1% a year, and some charge 0.03%. Funds charging around 1% cost far more over time: on $10,000 over 30 years, the difference between 0.03% and 1% is about $18,000.
Can $10,000 really turn into $700,000 in an index fund?
Only under very optimistic assumptions. Reaching about $600,000 to $700,000 in 30 years requires roughly a 15% return every year, about double the long-run average after inflation. A realistic planning figure at 7% is about $76,000, or about $203,000 if you also add $100 a month.
What happens to an index fund in a market crash?
It falls along with the market. In 2008 the S&P 500 lost about 37%. Investors who held on and kept investing recovered within a few years, while those who sold locked in their losses. Keeping an emergency fund means you don't have to sell during a downturn.
What is the 4% rule?
The 4% rule is a retirement rule of thumb: withdraw about 4% of your portfolio in the first year of retirement and adjust for inflation afterwards. A $203,000 portfolio would support about $8,100 in the first year. It's a guideline from historical research, not a guarantee.
Assumptions and sources
$10,000 at a 7% average annual return (roughly the long-term US stock market average after inflation; about 10% before inflation), compounded annually: about $19,700 (10 years), $38,700 (20 years) and $76,100 (30 years). $10,000 plus $100 a month at 7% compounded monthly: about $203,000 after 30 years and $426,000 after 40 years (calculated). Fees: 0.03% vs 1% a year over 30 years, about $75,500 vs $57,400. Bessembinder, H. (2018), "Do Stocks Outperform Treasury Bills?", Journal of Financial Economics (about 26,000 US stocks, 1926 to 2016). SPIVA U.S. Year-End 2025, S&P Dow Jones Indices (92.89% of active large-cap funds underperformed the S&P 500 over 20 years). 2008 S&P 500 total return about −37%. 4% rule: Bengen (1994), a rule of thumb, not a guarantee. No specific fund, ETF or stock is recommended. Sam and Alex are illustrative examples.
One new lesson every week
Each lesson builds on the one before. Subscribe on YouTube so you don't miss the next one.
Subscribe on YouTube See all lessonsKeep learning
Lesson 1 · Investing
What Happens If You Invest $100 a Month? The Honest Math
You put in $48,000. You could walk away with about $262,000. Here is exactly where the other $214,000 comes from, and why waiting ten years costs more than $140,000.
Lesson 7 · Investing
Compound Interest Explained: Why $25 a Week Becomes $284,000
$25 a week, invested for 40 years, could grow to about $284,000 even though you only put in $52,000. Here's the curve behind it, and why the first ten years feel like nothing is happening.
Lesson 13 · Investing
401(k) vs Roth IRA: Why It's a Perfect Tie (Until It Isn't)
Sam's 401(k) statement says $887,000 and Alex's Roth says $781,000. After tax, they keep exactly the same amount. Here's why, the four things that break the tie, and which account to fill first.